
Have you ever lost someone you love? Have you finally gotten over a bad relationship? Are you sick of hearing your best friend complaining about her lost love when you can’t find your very own true love?
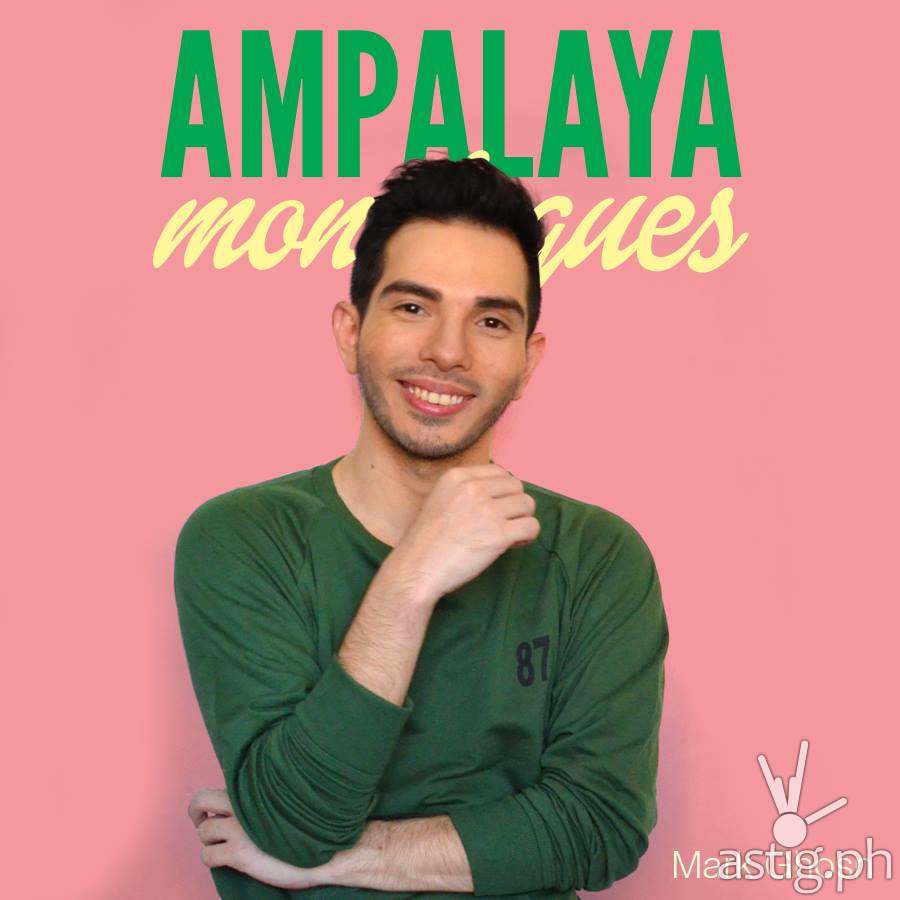
These and other “hugot” feelings will tug at your heart when the spoken artists of Theater in Alternative Platforms (TAP) bring its popular Ampalaya Monologues to the PETA Theater Center in New Manila, Quezon City for a one-night anniversary show on Saturday, October 15, 2016 at 6 p.m.
The first anniversary presentation of Ampalaya Monologues will wow audiences with the best 15 monologues and 5 new ones. This is a combination of dance, live music, and other exciting surprises.
Special guests
Special guest performers include spoken word artists Kookie Tuason, Maimai Cantillano, Zuela Herrera, Brian Vee, Rod Marmol, Mark Dimaisip, Rommel Pamaos, and Vim Nadera. Also present are musicians Pauline Lauron, Unwind, Chasing Deadlines, and Suicidal Genius, while live art will be provided by Cavity Collectives.
The short monologues of this episodic play were written by Mark Ghosn and will be delivered by TAP theater actors. They are about love, heartaches, and bitterness. Inspired by Eve Ensler’s play “The Vagina Monologues”, the show is set in a bar and tells the inspiring stories of diverse individuals who have tasted the different flavors of bitterness that love has to offer.
Powerful art movement
The story of the character on each monologue varies. There’s the bitter queen who got dumped for her own best friend; the boy next door who’s trying to get out of the friend zone; the single lady who is always the third wheel; the NBSB and her almost-lover; the LDR couple; the womanizer who was cheated; the guy experiencing his first moved-on moment; and many more.
Through the Ampalaya Monologues, TAP has created a powerful art movement and a whole new performance arena, gathering audiences in galleries, coffee shops, parks, bars, and other venues. It aims to bring the art of theater closer to people and make it more accessible to today’s generation.
What to expect
For the anniversary show, the cast and monologues to be presented are as follows: “Panata ng Pusong Bagong Laya” – Mark Ghosn; “Sa Pagitan ng Tayo Ba at Hindi Na” – Rain Gutierrez; “Hanash ng Soloista” – Janine Lloce; “Hindi Pwedeng Hindi Na” – Dave Ramones; “There’s A Basha in All of Us” – Mariko Urimoto; “Violet Ang Color ng Pag-ibig” – Berna Manipon; and “Mga Bulong sa Hangin” – Gracia Paterno.
Other monologues are “Akin Ka Na Lang, Please?” – Yves Gutierrez; “Ang Huling Tagay na Ilalaklak Ko Para Sa’yo” – Yan-yan Gervero; “Mga Sayaw sa Ilalim ng Mga Ilaw ng Pinakamahabang Pebrero” – Patty Arro; “Inukit sa Mga Tala” – Elizabeth Concepcion; “Saan Nagtatago Ang Mga Nawawalang Paalam?” – R’love Rojas; “Huwag” – Ace Alfaro; “Hanggang Throwback Na Lang” – Hogi Cadlum; and “Ikaw, Si Distance at Ako”- Euwie Von Loria.

Behind the scenes
The people behind Ampalaya Monologues are Mark Ghosn, artistic director/playwright; Dennis Marasigan, production consultant; Dave Ramones, technical director; Yan-yan Gervero, creatives; Toots Tolentino, publicist; and Mariko Urimoto, production manager.
For ticket inquiries, message PETA on facebook at www.fb.com/PETATheaterCenter. You may also call (02) 725 6244 local 23, text 09273917379, or go to www.ticketworld.com.ph.


